By Max Olson, Global Risk Management Inc.
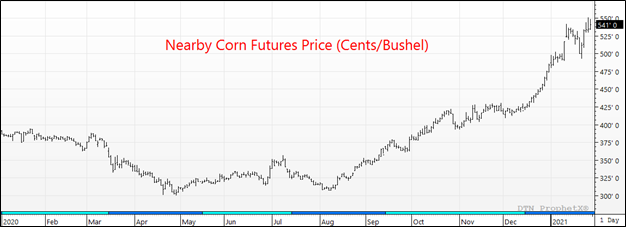
The nearby corn futures in the U.S. have rallied $1.50 since the beginning of November (+38%), attempting to ration demand amidst the significantly tighter domestic supply estimates. On the January USDA report, the U.S. ending stocks for the 20/21 crop year were estimated at 1.552 billion bushels, or an ending stocks-to-use ratio of 10.6%. However, even the historically tight supply outlook was still considered conservative and met with skepticism from the trade. This stemmed from the USDA lowering their feed demand by 50 million bushels (despite record Q1 feeding) and their export demand by 100 million bushels (despite record commitments on the books) in order to keep stocks at a more conservative level.
However, the price action over the past month and the large-scale purchases from China this week are confirming that stocks will likely need to be revised lower in upcoming months. The USDA’s January report pegs Chinese imports of corn from all destinations at 17.5 million metric tonnes (MMT) for 20/21. This estimate is up 130% from China’s 19/20 imports of 7.6 MMT and their 2018/19 imports of 4.48 MMT.
With the massive 5.85 MMT of U.S. corn booked this week for delivery in 20/21, China already has more than 17.5 MMT’s on the books with the U.S alone. Not to mention they have been poking around in Ukraine for supply as well. In past years, discounting Chinese export sales was a more common occurrence given the propensity for cancellations of those contacts, but following the poor weather that impacted their corn crop this year and the rebuilding of their hog herds (and overall protein expansion in recent years) they clearly have a major need for the grain this time around.
South America will help to take some pressure off the U.S. in upcoming months once their harvests begin in earnest, but the question then becomes how much can that displace the sales already on the books between the U.S. and China? Even before this week’s buying spree from China, the U.S. already had commitments on the books for 75% of the total marketing year estimate (2.55 billion bushels) that runs from September through August. Last year at this time the U.S. had 50% of the crop year total on the books, and the 5-year average is closer to 58%. Clearly this percentage will expand further this upcoming week once the most recent commitments are factored in, but either way the U.S. still has some work to do in rationing enough demand. How much of this will be factored into upcoming monthly supply and demand forecasts is yet to be seen, and remains a large question mark going forward.
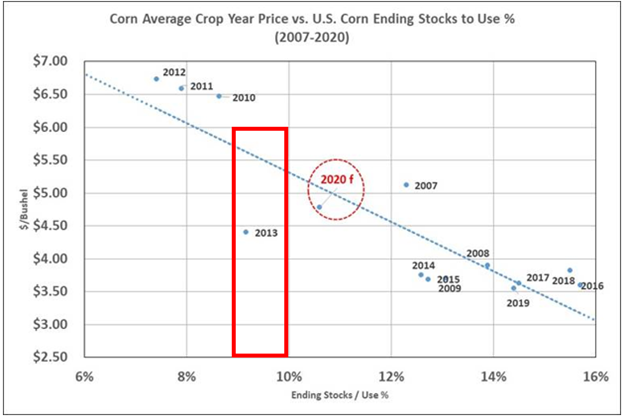
Using our U.S. stocks-to-use ratio vs. crop year average price chart below, it would suggest that if the U.S. stocks-to-use ratio is closer to 9% – 9.5% this year, prices are still undervalued at the current market. Based on the historical trend, this stocks to use range would then imply crop year average prices could be $5.25 – $5.75 for the 20/21 crop year.
Commodity trading is not suitable for all investors. There is an inherent risk of loss associated with trading commodity futures and options on futures contracts, even when used for hedging purposes. Only risk capital should be used when investing in the markets. Past performance is not indicative of future results.